In contrast to data sets 1 and 2, data set 3 exhibits periodic patterns. The -spectra does not indicate a strong signal at any specific angle, suggesting that the patterns do not have a clear orientation (fig.1 first row). When the system approaches the transition (fig.1 from left to right panel), the distribution of values of the data set goes from one peak reflecting the absence of patterns, to a two-peak distribution due to the occurrence of both phases (vegetation and bare soil) in the system after the emergence of spatial patterns, and finally to a distribution that is skewed toward small values because of the dominance of bare soil in the system.
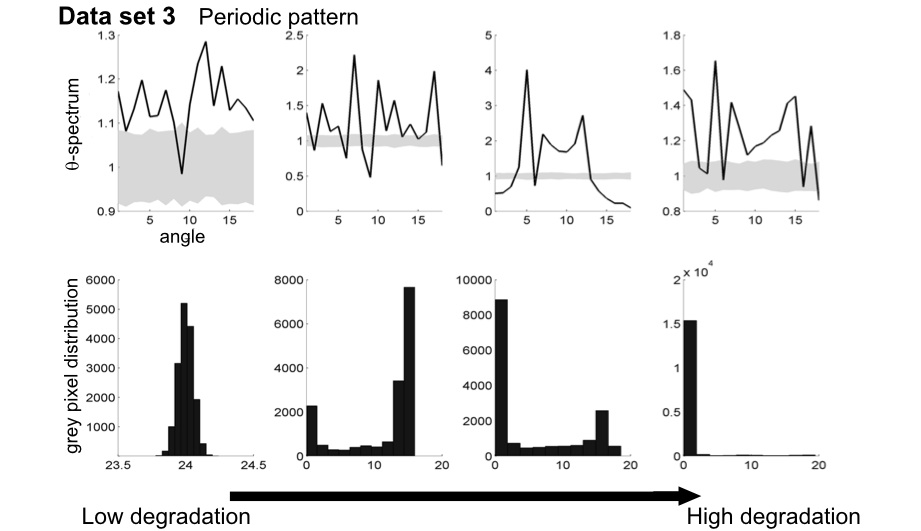
figure 1: along each row, the system approaches the transition from left to right. Gray areas corresponds to 95% confidence interval obtained from a null model (i.e. data sets of same size generated by reshuffling the original matrix).