1
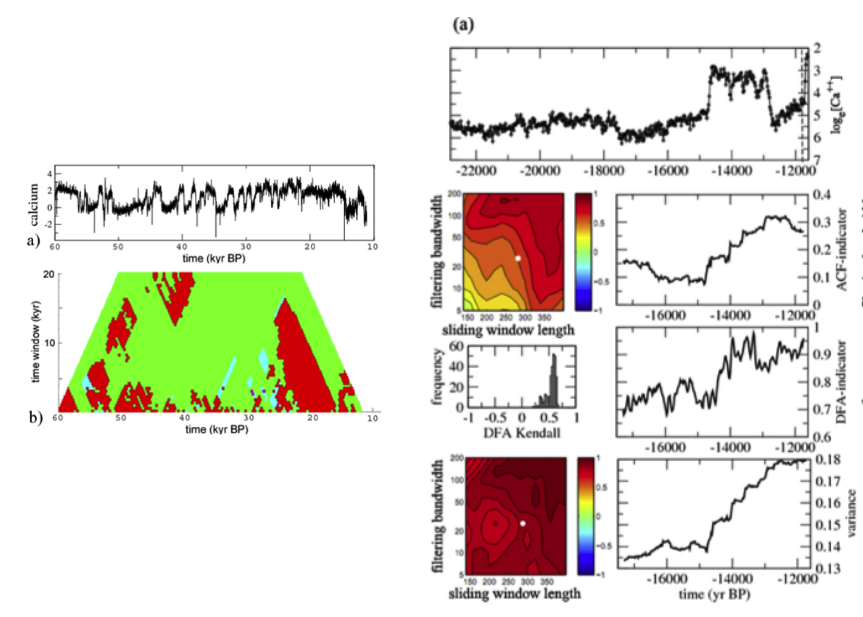
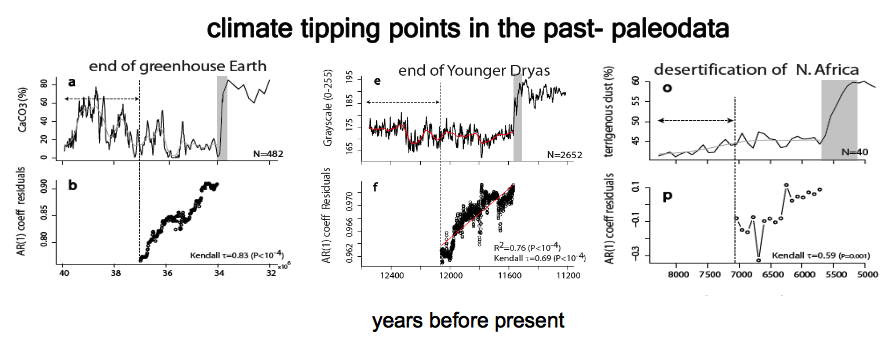
In the Earth´s history climate stability was the exception rather than the rule. Figure 1 demonstrates few of the instances that the climate shifted back and forth between different states, in some cases even trapped in one of them. For instance the shift to a greenhouse Earth some 34 Myrs ago. Or the shutdown and restart of the thermohaline circulation and exit of the Younger Dryas after the interludes of glacial shifts. More ¨recently¨ the shift of the Sahel to a desert (fig2).
2
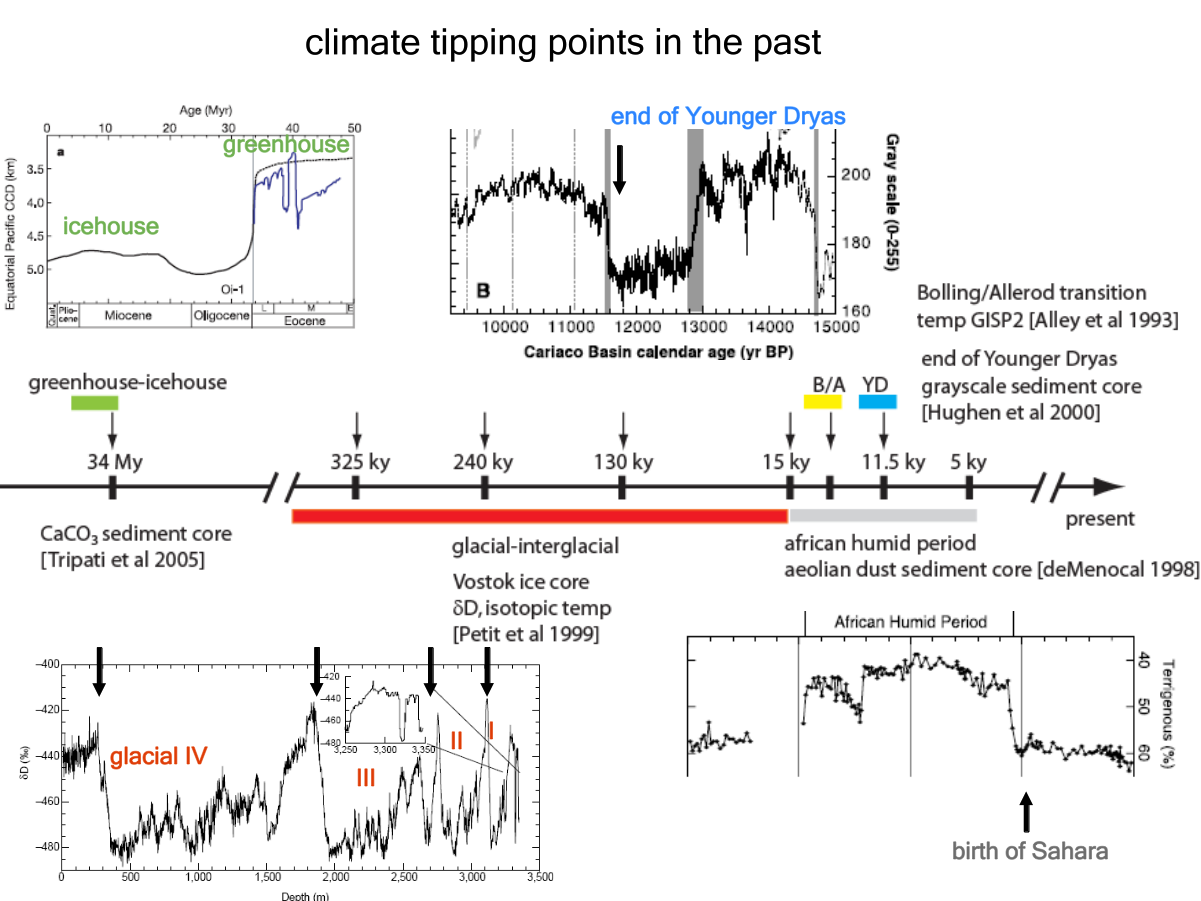
When one looks at the shift of the Sahel to the present desert state from a more savanna-like regime, it seems that it would have been difficult to predict that around 6,000 years ago such transition would take place (fig2). Similar difficulties in foreseeing such changes are encountered in all past abrupt climate shifts, and cause great concern for potential future ones. Even if mechanisms are more or less known, complex models nor mechanistic insight are enough to describe and, more importantly, to anticipate such changes.
3
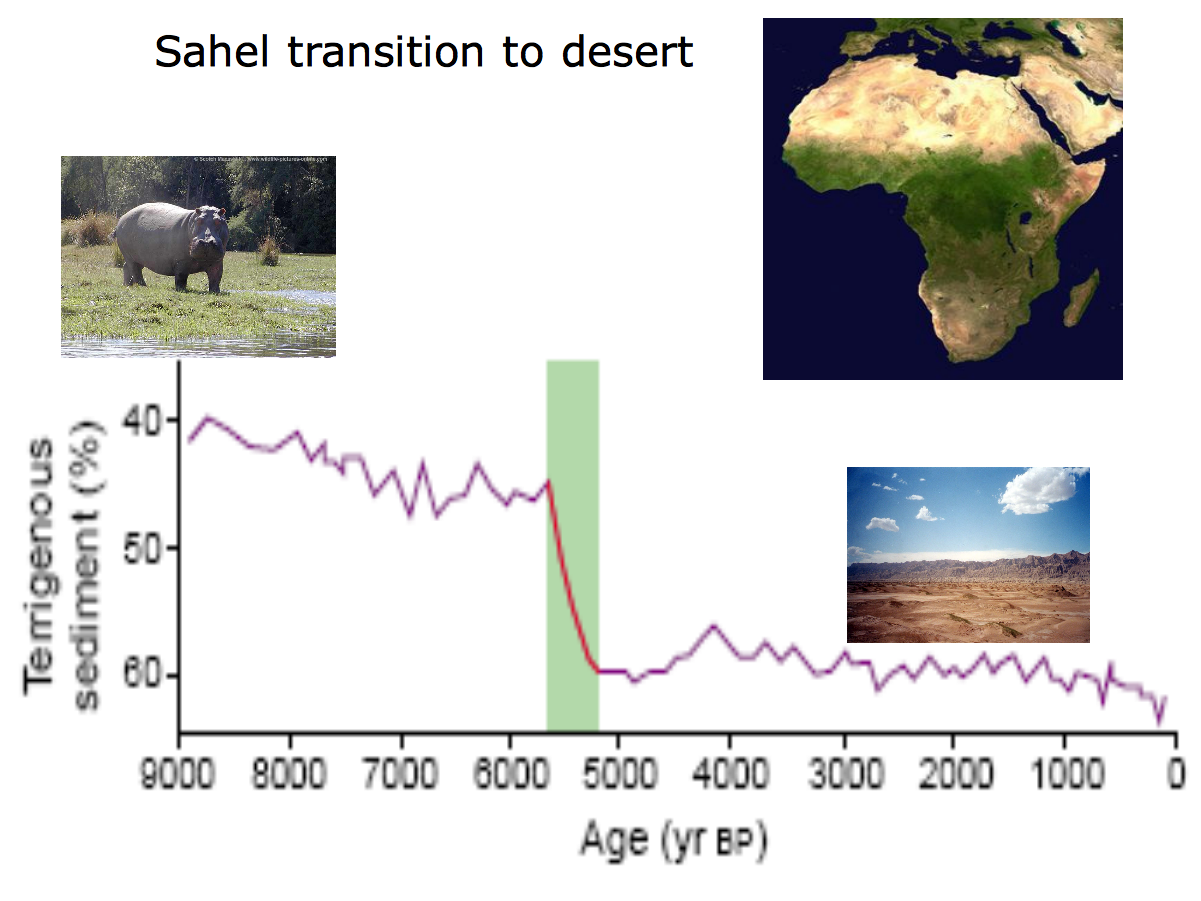
Various studies have looked into simulated data and paleo-records to test whether these past events could be anticipated by early warning signals. Basic motivation of these studies is that the specific mechanisms that are believed to explain how these shifts occur, give rise to the existence of critical points and critical transitions (fig3). Based on simulations ranging from simple to more complex climate models (Held & Kleinen 2004, Dakos et al 2008, Lenton et al 2009), various studies have shown that in principle one could detect these transitions when measuring changes in autocorrelation at-lag-1 (Held & Kleinen, 2004) or spectral properties (Kleinen & Held 2003).
4
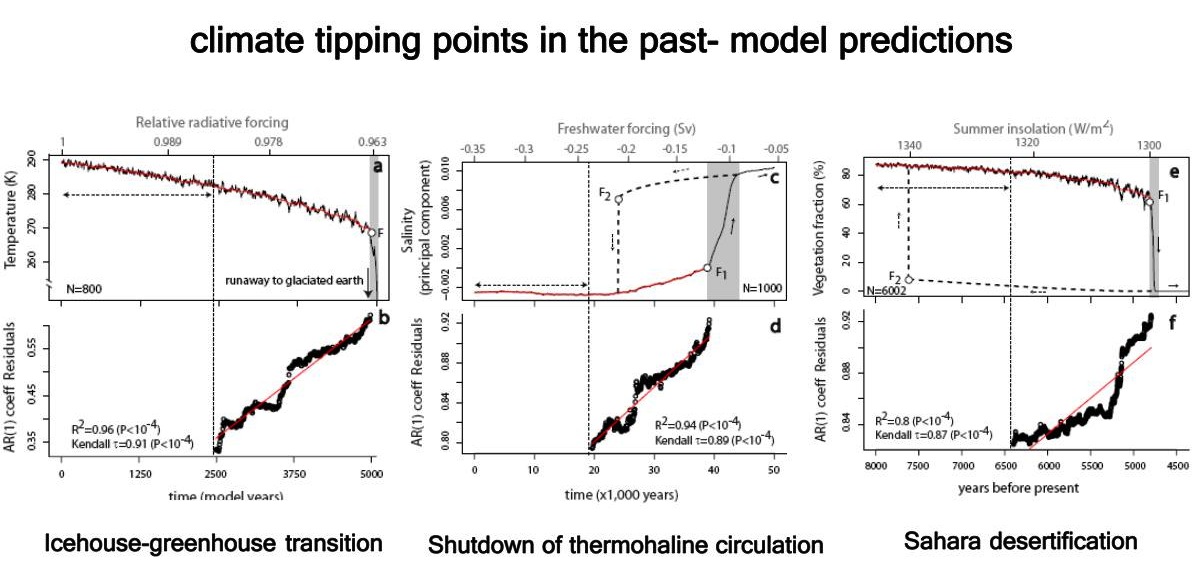
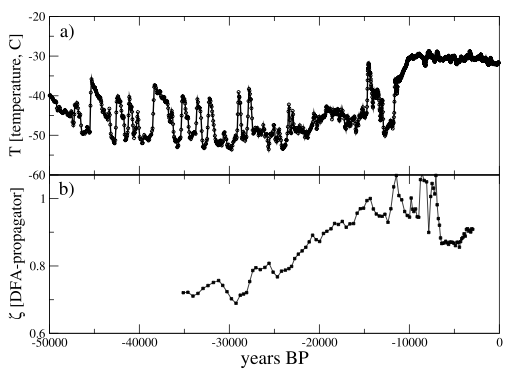
These model expectations were largely confirmed in empirical studies that analysed climate proxies derived from paleoclimate records. Taking only the data that correspond to the part if the records before the transition, these studies estimated generic early-warning signals within sliding windows to find that a pattern of critical slowing down was present in the majority of the cases. Critical slowing down was measured as increase in autocorrelation at-lag-1 (fig4) or increase in DFA exponent (fig5).
5
These metrics, together with variance (Lenton et al 2012) and a later addition of potential analysis (Livina et al 2010), are being widely applied to a variety of simulated and paleodata derived from different proxies according to the methodology we describe in this early warning signal toolbox (fig6). Potential analysis identifies multimodal distribution of data in the timeseries and indicates the existence, appearance or disappearance of alternative attractors. For example, in fig6 left low panel shows the existence of one (red color) or more attractors (other than red color) in the time series derived from the GRIP ice core during the DO event, BA and YD transitions (see fig1). The right panels are estimating early warning signals in the same record (but focusing only during the last deglaciation). This is a typical analysis pursued for detecting transition in climate records.
