1
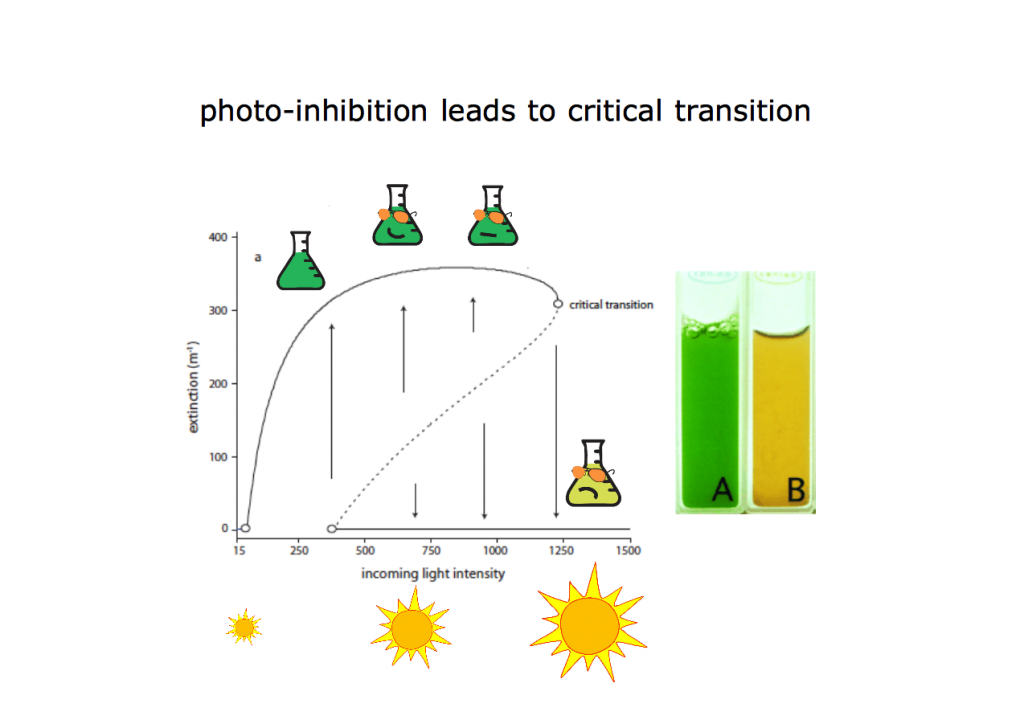
One type of critical transition that has been studied in the lab is the shift to extinction when plankton organisms are exposed to excess light irradiance. The idea is simple. As light is a necessary resource for growth of planktonic organisms, increasing light would also mean increasing growth. Such growth however is not sustained at high light intensities. Plankton has the capacity to shelf shade and protect itself from excessive light exposure, but once a critical threshold of light intensity is crossed, the population cannot survive and the system collapses to extinction (fig2).

2
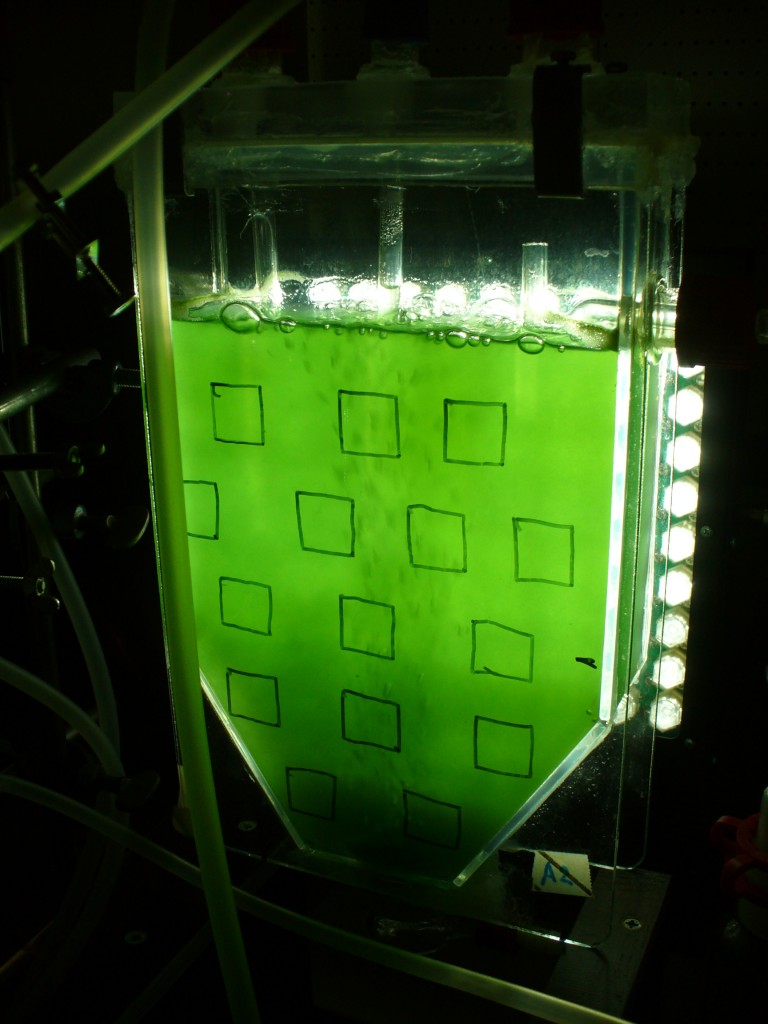
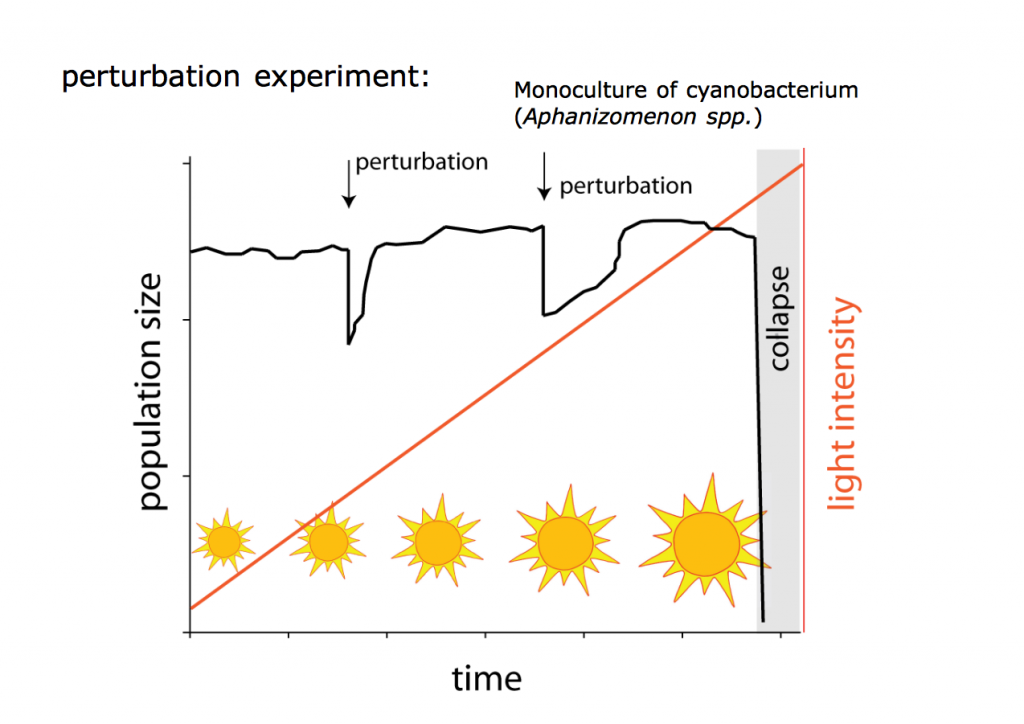
So Veraart and colleagues (2012) used this mechanism to study whether one could infer the proximity to extinction by performing perturbation experiments. The idea was simply based on the fact that if the system would crash at the critical transition, then critical slowing down should be manifested and measures as a decrease in recovery rate close the transition (fig3). So they designed an experiment in a chemostat (fig1), where they progressively increased incoming light intensity up to the point that the plankton monoculture in the chemostat will not have been able to maintain itself and instead collapse. During the gradual increase of light, perturbations were performed, by removing 10% of the plankton density via dilution. After the removal, they measure the rate with which density recovered back to the initial equilibrium. They performed 6 of such perturbations.

3
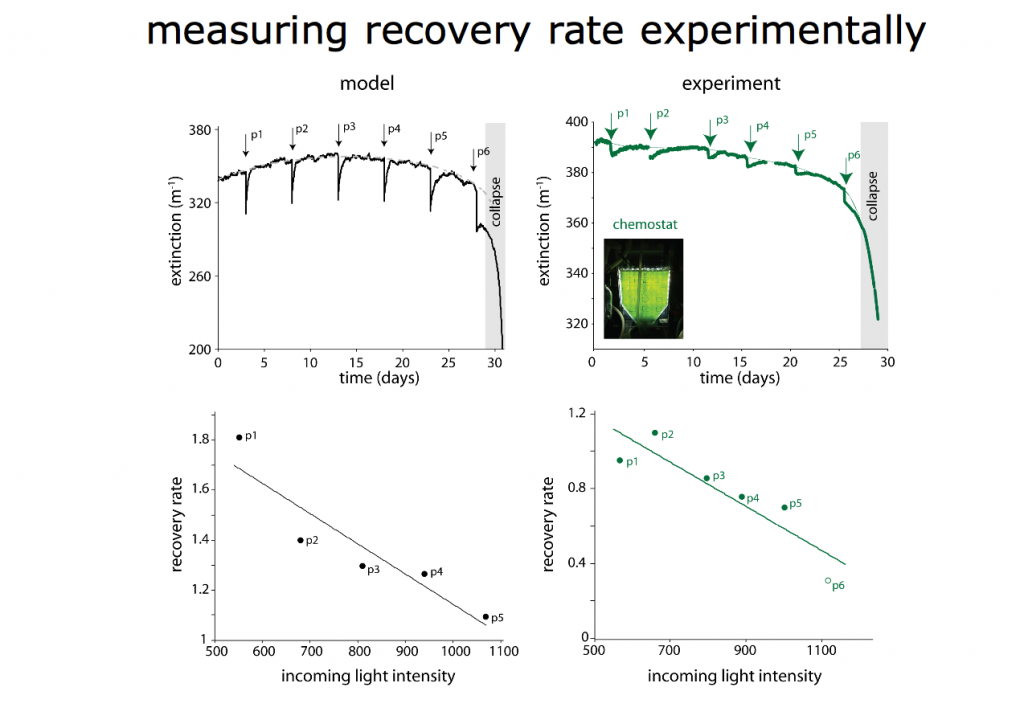
If one would simulate the same experiment in the computer, as expected from theory, the plankton would need progressively more time to bounce back after the perturbation the higher the light intensity (or the closer the system was to the critical transition). This is depicted in the left panels of fig4. Upper left panel shows the fate of the simulated plankton density with the perturbation experiments (p1-6), whereas the lower left panel plots the recovery rates after each disturbance. Strikingly, the experimental results resembled the theoretical expectations (fig4 right panels). During the 30+ days that the experiment ran, each perturbation (upper right panel) took longer to bounce back and a lower recovery rate was documented closer to the transition (lower right panel).
