Basics
Detrended fluctuation analysis (DFA) can be used to measure increases in short- and mid-term ‘memory’ in a time series of a system close to transition. Instead of estimating correlations at a given lag (like autocorrelation at-lag-1), DFA estimates a range of correlations by extracting the fluctuation function of a time series of size s. If the time series is long-term power-law correlated, the fluctuation function F(s) increases as a power law; , where a is the DFA fluctuation exponent. The DFA fluctuation exponent is then rescaled to give a DFA indicator, which is usually estimated in time ranges between 10 and 100 time units, and which reaches value 1 (rescaled from 1.5) at a critical transition. Although, the DFA captures similar information as autocorrelation at-lag-1, it is more data demanding (it requires > 100 points for robust estimation).
Example
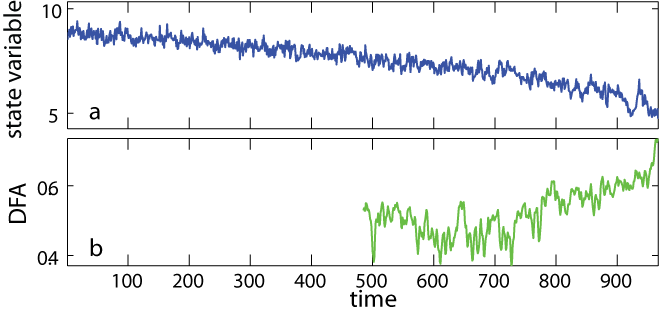
We present the DFA method applied to a simulated time series in which a critical transition is approaching (panel a). The DFA indicator signaled an increase in the short-term memory (panel b). It was estimated in rolling windows of half the size of the original record after removing a simple linear trend for both datasets. Despite oscillations, we could quantify its trend using Kendall’s τ (see General Steps for Rolling Window Metrics). The values of the DFA indicator suggested that the time series was approaching the critical value of 1 (transition).
