Spatial data in ecology are typically obtained by field studies, data collecting devices placed at various locations of an ecosystem or extracted from spatial imagery. In any of these cases, the nature of data at a given spatial location can be of two types: (a) a discrete occupancy data, such as presence or absence of the variable of interest at each pixel of an image, or (b) a continuous variable, such as NDVI (Normalized Difference Vegetation Index) at each pixel or nutrient concentration at each sampling point.
Examples
We illustrate here the application of spatial indicators in three synthetic data sets using three representative models of tipping points and self-organization in ecological systems. The three models treat ecological variables in a spatially-explicit framework with stochasticity. They all describe vegetation dynamics under resource limitation or grazing pressure, but they differ in the nature of ecological interactions and the emerging spatial vegetation structure.
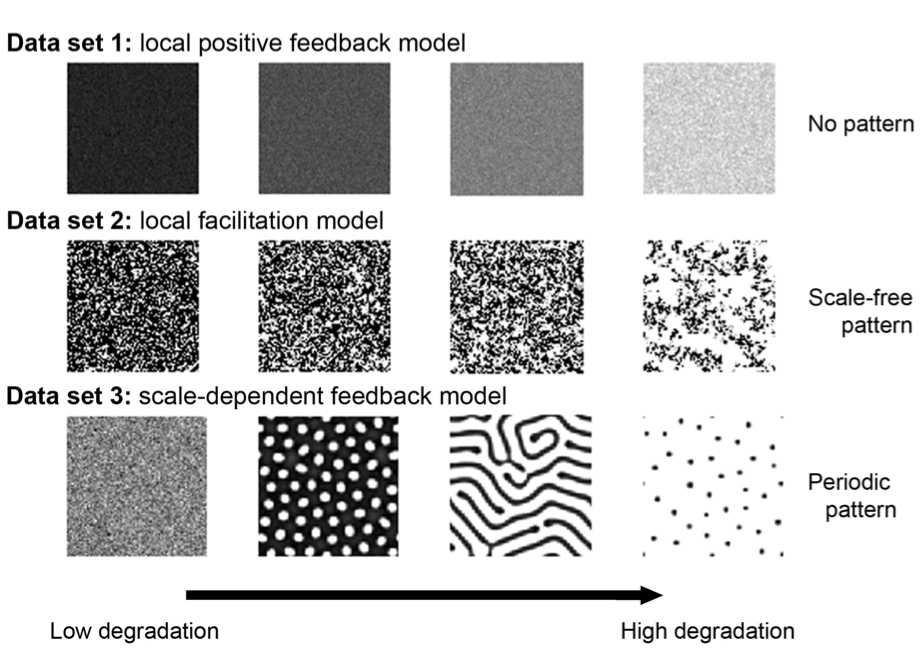
- Data set 1 was obtained from a local positive feedback model resulting in a non-patchy vegetation structure (fig.1 first row). Locally, vegetation density grows logistically and is lost due to grazing. Biomass and water are exchanged between neighboring sites at a certain rate due to diffusion. As rainfall falls below a certain threshold, the ecosystem undergoes an abrupt transition from a globally high vegetation density to a bare state due to the nearly synchronous shifts of each of the sites to a desert state.
- Data set 2 is based on a local facilitation model that exhibits spatial patterns characterized by a scale-free patch-size distribution. In this stochastic cellular automaton model, an ecosystem is represented by a grid of cells, each of which can be in one of three discrete states: vegetated (+), empty (o) or degraded (−). Empty cells represent fertile soil whereas degraded cells represented eroded soil patches unsuitable for recolonization by vegetation. A key ecological mechanism is the positive effect of vegetation on its local neighborhood through increased regeneration of degraded cells. Because of this local facilitation, vegetated cells tend to form clusters (fig.1 second row). When the environmental conditions become harsher, there is a point at which the vegetation dies out and the system becomes a desert.
- Data set 3 is based on a scale-dependent feedback model that results in periodic (Turing-like) spatial vegetation patterns. The model is a reaction-diffusion model of vegetation biomass, soil water and surface water. Plants grow due to soil water availability and die due to natural mortality and/or grazing. The infiltration rate of water in the soil is higher in areas with vegetation than in bare soil, leading to the accumulation of water under vegetation and to its depletion further away, resulting in a scale-dependent feedback responsible for the formation of regular vegetation patterns (fig.1 last row). When water availability becomes limited, a homogeneous vegetated state becomes unstable leading to self-organized patterns such as gaps, labyrinths and spots. A further reduction in water availability leads to a transition into a desert state.
All three models exhibit a transition from one state (e.g., vegetated) to an alternative state (e.g., desert) as an external parameter (such as rainfall, grazing, etc) changes.