We used DFT analysis to estimate the -spectra as a function of wavenumbers for all the three data sets (fig.1). The first and second data sets (fig.1, first and second row) show a noisy pattern indicating that contribution to
-spectra is not significant for all wavenumbers. However, the
-spectrum for the third data set, the scale-dependent feedback model, shows a clear peak (fig.1, last row) even far from the transition. The peak indicates that there is dominant wavelength (corresponding to a characteristic patch size) which is a signature of periodic patterns.
Therefore, we conclude that the two first data sets are not periodic whereas the last one shows some spatial periodicity.
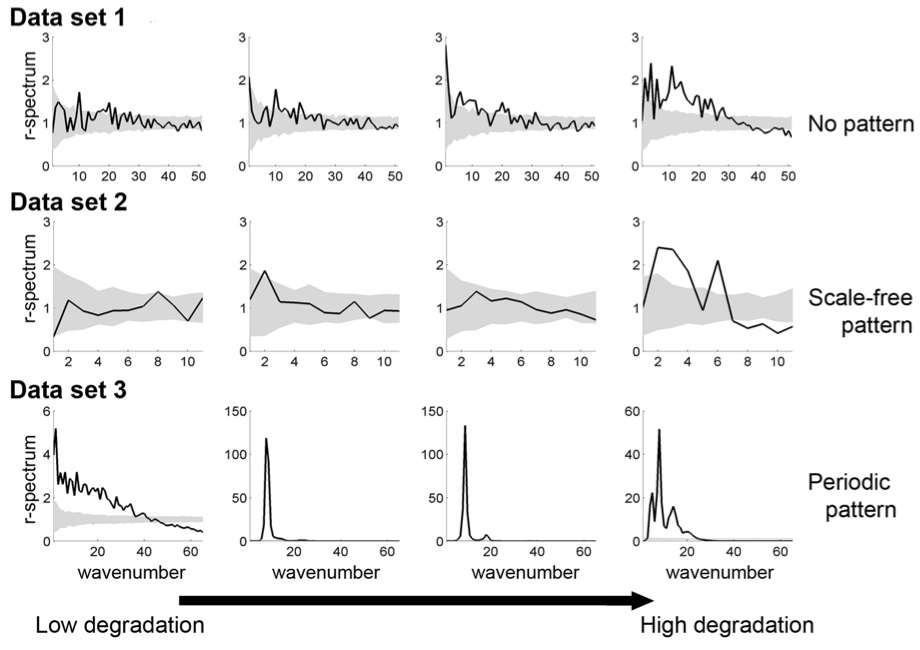
figure 1