- The spatial statistics that need to be evaluated depend on the type of data set (with discrete or continuous values) at hand. For example, dataset 2 is made up of discrete data indicating the presence or absence of vegetation in each cell. For this data set, we need to transform the data by a coarse-graining procedure. This is done by submatrices (e.g. of 5×5 cells) in which we counted the number of cells occupied by vegetation. This results in matrices that are 25 times smaller than the original ones with values between 0 and 25. The size of the submatrix used to transform the original data may affect the behavior of the indicators.
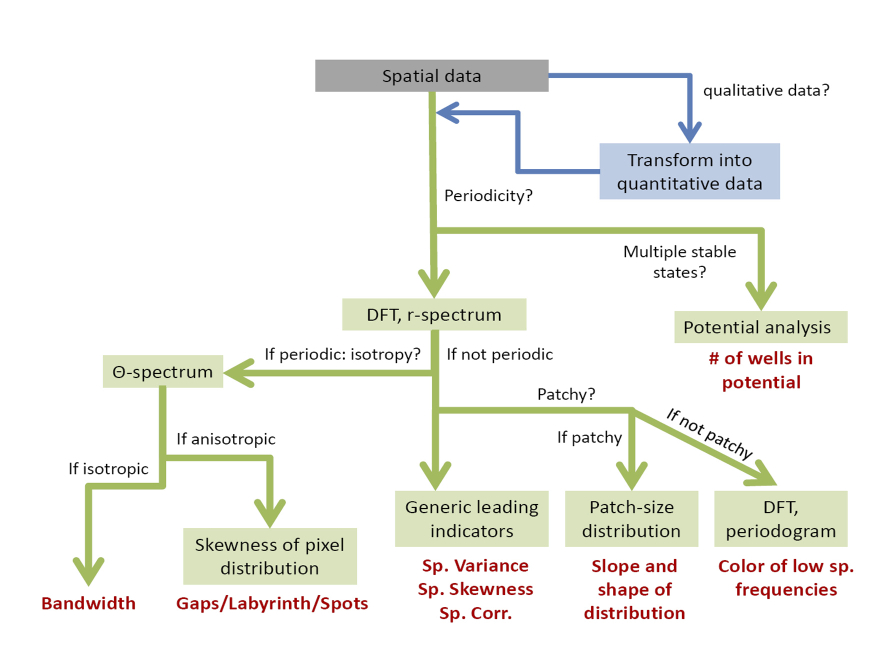
- The first question to ask is whether the patterns observed are periodic or not. The
-spectrum obtained from the DFT analysis provides information about whether the patterns are periodic, while the
-spectrum indicates whether the patterns are isotropic (i.e. with no specific orientation) or anisotropic (i.e. with a specific orientation, e.g. band-like patterns).
- If the patterns are not periodic, the generic leading indicators (i.e. spatial variance, spatial skewness and spatial correlation between nearby sites) may be used and the power spectrum should be checked for possible reddening.
- If the patterns are not only irregular but also patchy (e.g. can be characterized by two phases), the patch-size distribution may be estimated.
- If the patterns are periodic and with no specific orientation (anisotropic), the wavelength of the pattern should be evaluated. The wavelength is equivalent to the dominant length scale of the pattern provided by the
-spectrum.